
ICIMOD uses NASA and USGS data to help Nepalese officials address severe drought
Remote districts of Western Nepal are experiencing what some claim is their worst drought in 40 years. The Asia News reports that in the northwestern region known as the Karnali, there has been no rain since last July and farmers have lost half their crops. The article calls conditions in the districts of Humla, Dolpa, Kalikot, Jumla, and Mugu “desperate.” Earth observation satellite data from NASA is assisting Nepal’s Ministry of Agricultural Development (MoAD) in identifying areas of severe drought to guide decisions about how to reduce the impact on people in the region.
These people depend almost wholly on agriculture (rice, corn, potatoes, barley, beans, buckwheat, millet, and soybeans) for their livelihoods – and for food. With no irrigation facilities, lack of rainfall can be devastating. Analyses prepared by the International Center for Integrated Mountain Development (ICIMOD) based on the satellite data are helping the Government of Nepal evaluate the situation and make critical decisions about how to respond. ICIMOD promotes use of Earth Observation data to improve water planning and related decision-making through implementing the SERVIR-Himalaya and Koshi Basin programs.
“The World Food Program (WFP) is using our analyses to understand the drought onset and severity patterns across the region,” explains Faisal Qamer, a Remote Sensing Specialist at ICIMOD. “They are using these SERVIR products as evidence-based communication to inform the highest level governmental decision makers in Nepal on the issue.”
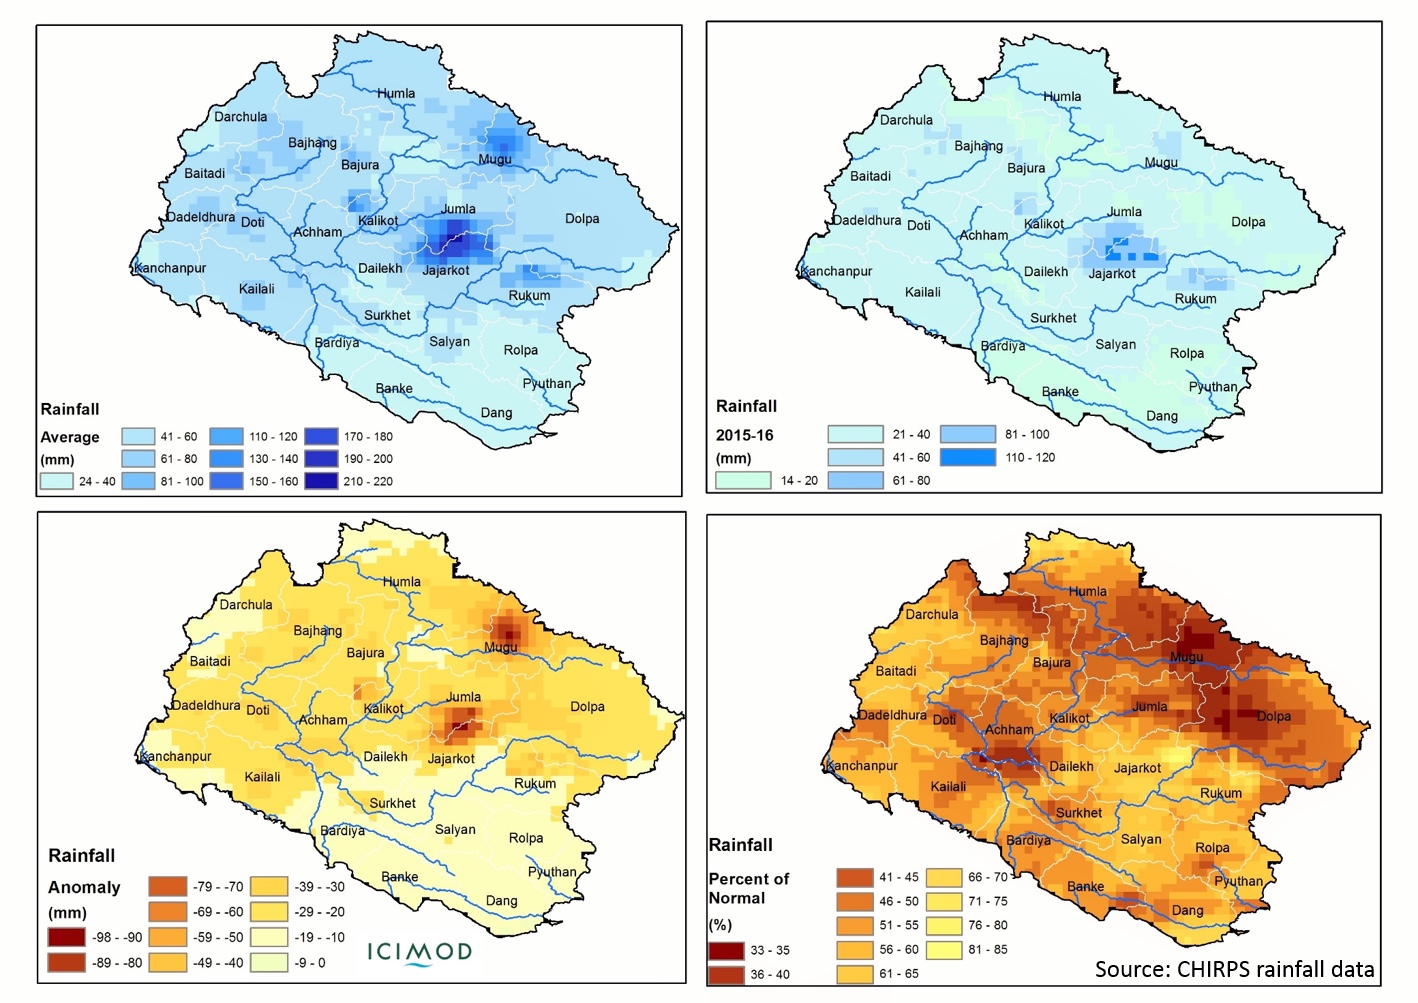 |
| Cumulative rainfall during Nov 2015-Jan 2016; Source: ICIMOD, based on CHIRPS data Top left: 30-year average cumulative rainfall during months of Nov, Dec, and Jan Top right: Cumulative rainfall observed this season (Nov 2015 – Jan 2016) Bottom left: Rainfall deficit observed this season (Nov 2015 – Jan 2016) Bottom right: Percent of normal (30-year average) cumulative rainfall this season (Nov 2015 – Jan 2016); e.g., areas in Mugu received only 35% of the amount of rainfall received in a normal year. |
As WFP’s Maan Kshetri told ICIMOD/SERVIR: “We will use every product that you provide as very useful scientific information to support our analysis.”
WFP and MoAD jointly produce periodic Food Security Bulletins profiling the current and forecasted situation for food security – and food shortages -- in Nepal by district. The assessments in the bulletins are based in part on Earth observation satellite data and products provided by ICIMOD/SERVIR.
A recent presentation by WFP to the National Planning Commission of Nepal’s Vice Chairman and to the Nepal Ministry of Federal Affairs and Local Development and MoAD used such data to help these officials visualize this year’s conditions as compared to past years and understand the severity of the current drought and its effect on food crops. Kurt Burja, head of WFP's Vulnerability Assessment and Mapping unit in Nepal, noted that the goal was to demonstrate “the extent of the problem so stakeholders can begin to plan appropriate interventions.”
Rainfall data provided by ICIMOD/SERVIR for this important WFP presentation came from a 30-year record of rainfall derived from extensive satellite and ground data and known as CHIRPS (short for Climate Hazards Group InfraRed Precipitation with Station). It was compiled by SERVIR Applied Sciences Team member Jim Verdin and the United States Geological Survey (USGS) Climate Hazards Group. Kshetri called the data (shown below) “powerful evidence of drought occurring in the Karnali area.”
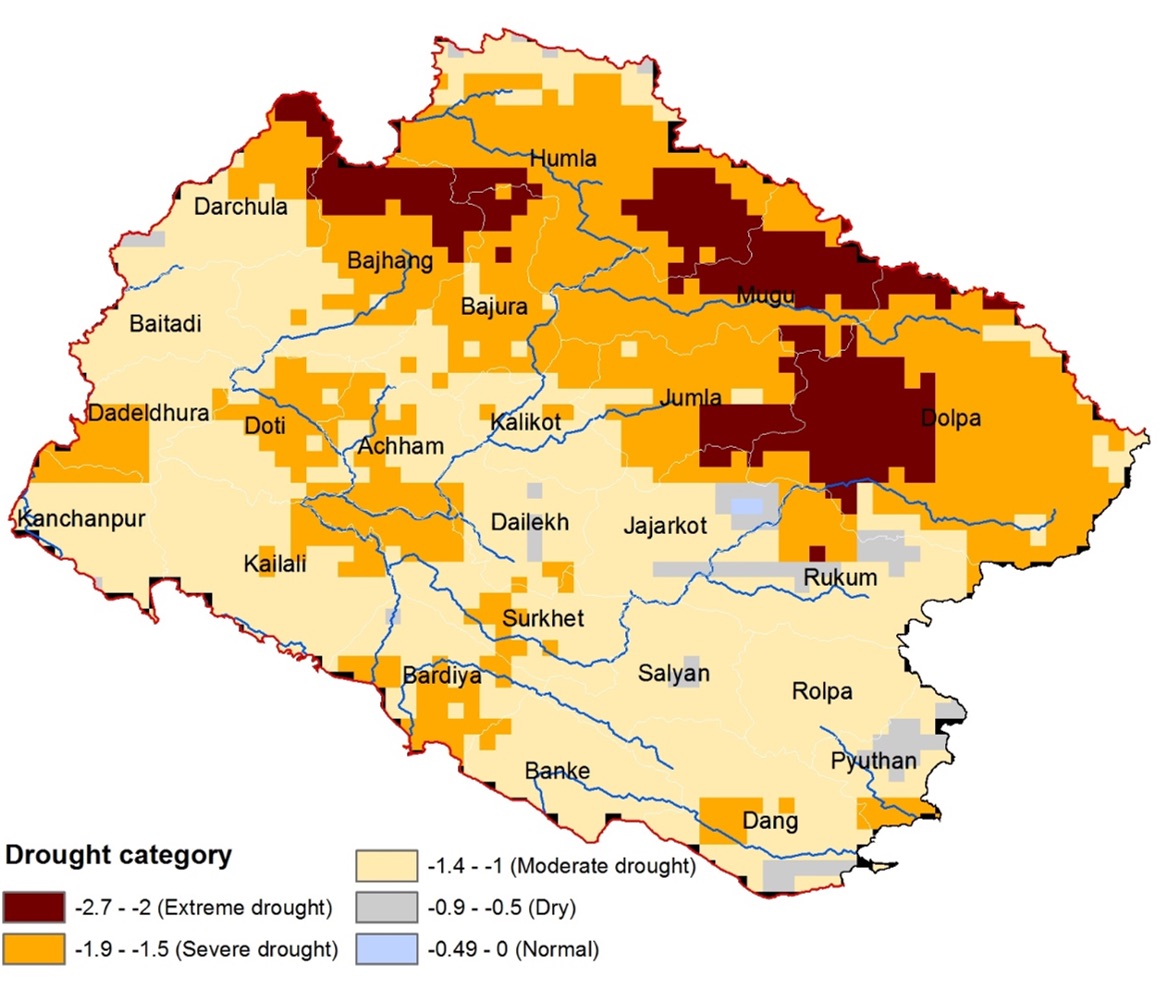 |
| Drought conditions across the mid-western and far-western regions |
The data reveals current “extreme” drought in nine districts and “severe” drought conditions in many districts in the mid- and far-western regions of Nepal. Specifically, it showed Nepal government officials that there was much less cumulative rainfall from November 2015 to January 2016 than during those same months in a normal year.
The map at right indicates agricultural drought conditions in many districts.
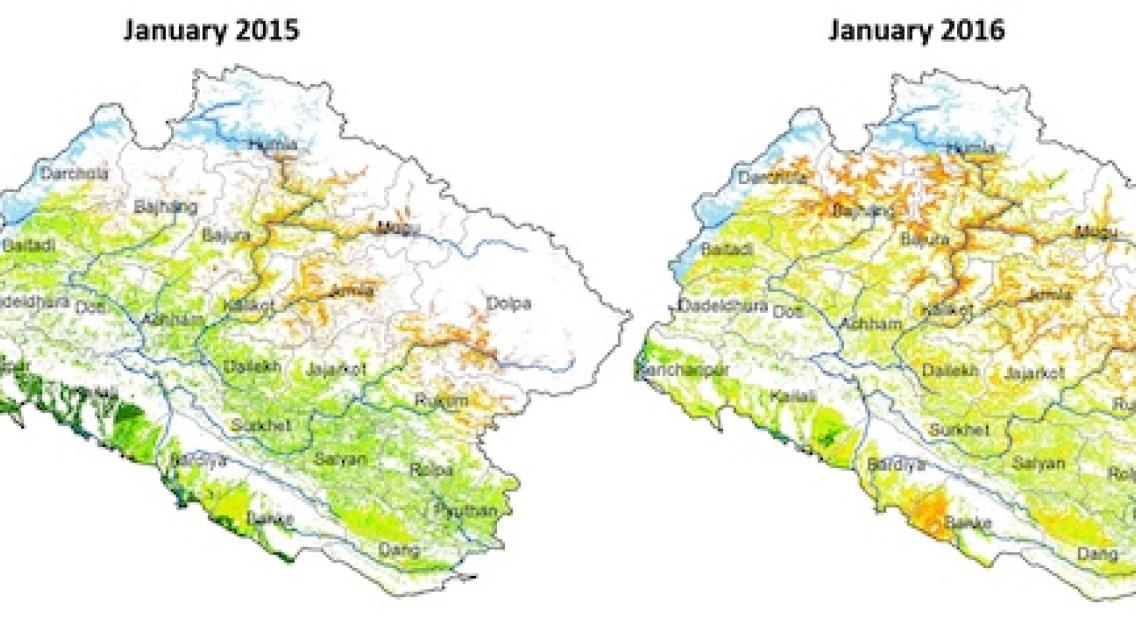
In addition, vegetation data* (see below) derived from NASA’s MODIS sensor shows that crop health in Nepal is much weaker this year over a much larger geographic area than last year at the same time. The situation is forecasted to get worse between March-July 2016. The recent winter drought is expected to greatly reduce winter crop (wheat, barley) harvest in May 2016.
All of this data from ICIMOD/SERVIR has demonstrated to the Government of Nepal that the food security situation is a matter of great concern. Government officials are using the data to help plan for providing humanitarian assistance.
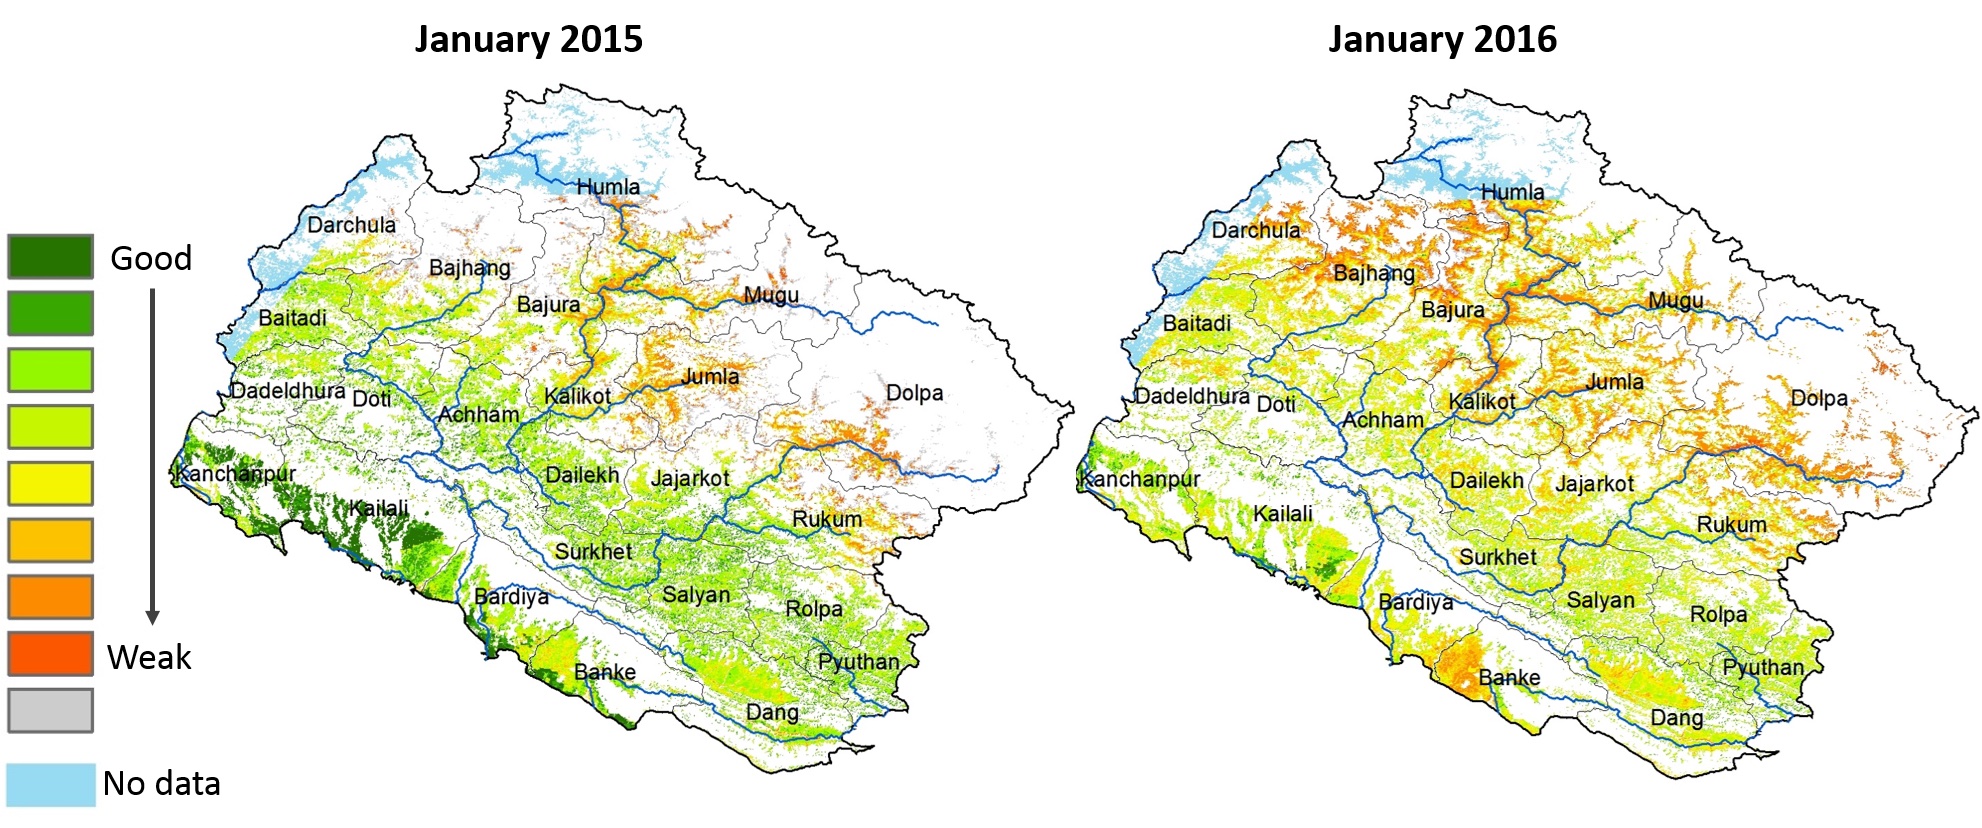
Vegetation conditions in agriculture and rangelands areas, mid & far western regions;
weak vegetation conditions in 2016 are more severe and affect a much larger geographic area
than last year. (In normal years January is considered the peak of greenness for the wheat crop.)
Notes:
*This Normalized Difference Vegetation Index, or NDVI, data allows officials to compare recent vegetation conditions with the long term average and with past years to identify anomalies and predict whether crop yields for the current year may be greater or lower than average in these regions.
CHIRPS is normalized such that all of the available rainfall data, from 30 years to present, is available in a consistent format, allowing meaningful comparison.
Satellite data is especially useful for gathering precipitation data for rural regions lacking ground stations. When ground data is available, it can be used to validate/correct satellite data, resulting in more accurate measurements.