
SERVIR develops tool for assessing agricultural practices
In SERVIR regions, agricultural measures such as irrigation, improved fertilization, and advanced cultivars have the potential to increase food security and ensure climate resilience. However, to broaden support for such activities, environmental managers must be able to assess their impact. Because field data for estimating the impact of agricultural practices is often difficult to obtain, decisions about using them are often made based on limited information.
SERVIR has developed a user-friendly, web-based tool called AgriSERV that provides two important satellite datasets together in one system to help decision-makers in SERVIR’s data-sparse regions assess the impact of agriculture interventions. With this tool, development practitioners, scientists/researchers, and government decision-makers can visualize and download vegetation condition data and historical rainfall data. The specific datasets providing the basis for analysis are eMODIS Normalized Difference Vegetation Index (NDVI) and Climate Hazards Group InfraRed Precipitation with Station data (CHIRPS) rainfall data.
Vegetation health is a good indicator of crop vigor, and several studies have connected changes in satellite-derived vegetation indices to crop yields and the length of growing season. By analyzing the vegetation index data along with a rainfall dataset, areas with and without intervention can be compared and analyzed to assess the impacts of the intervention strategy and identify similar areas where the same strategy could be used.
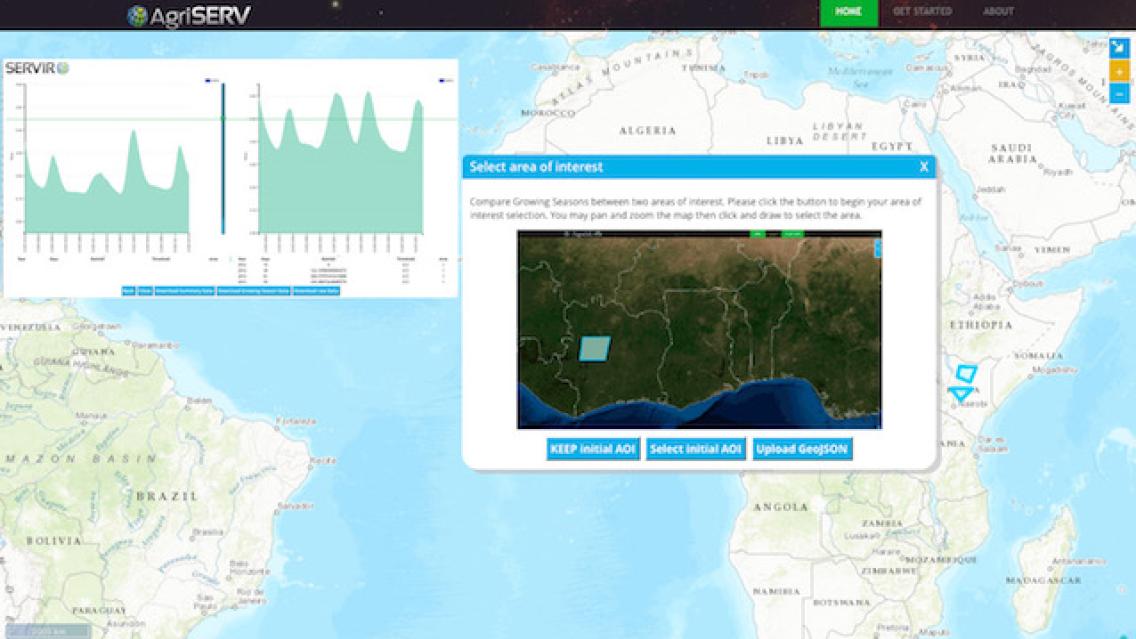
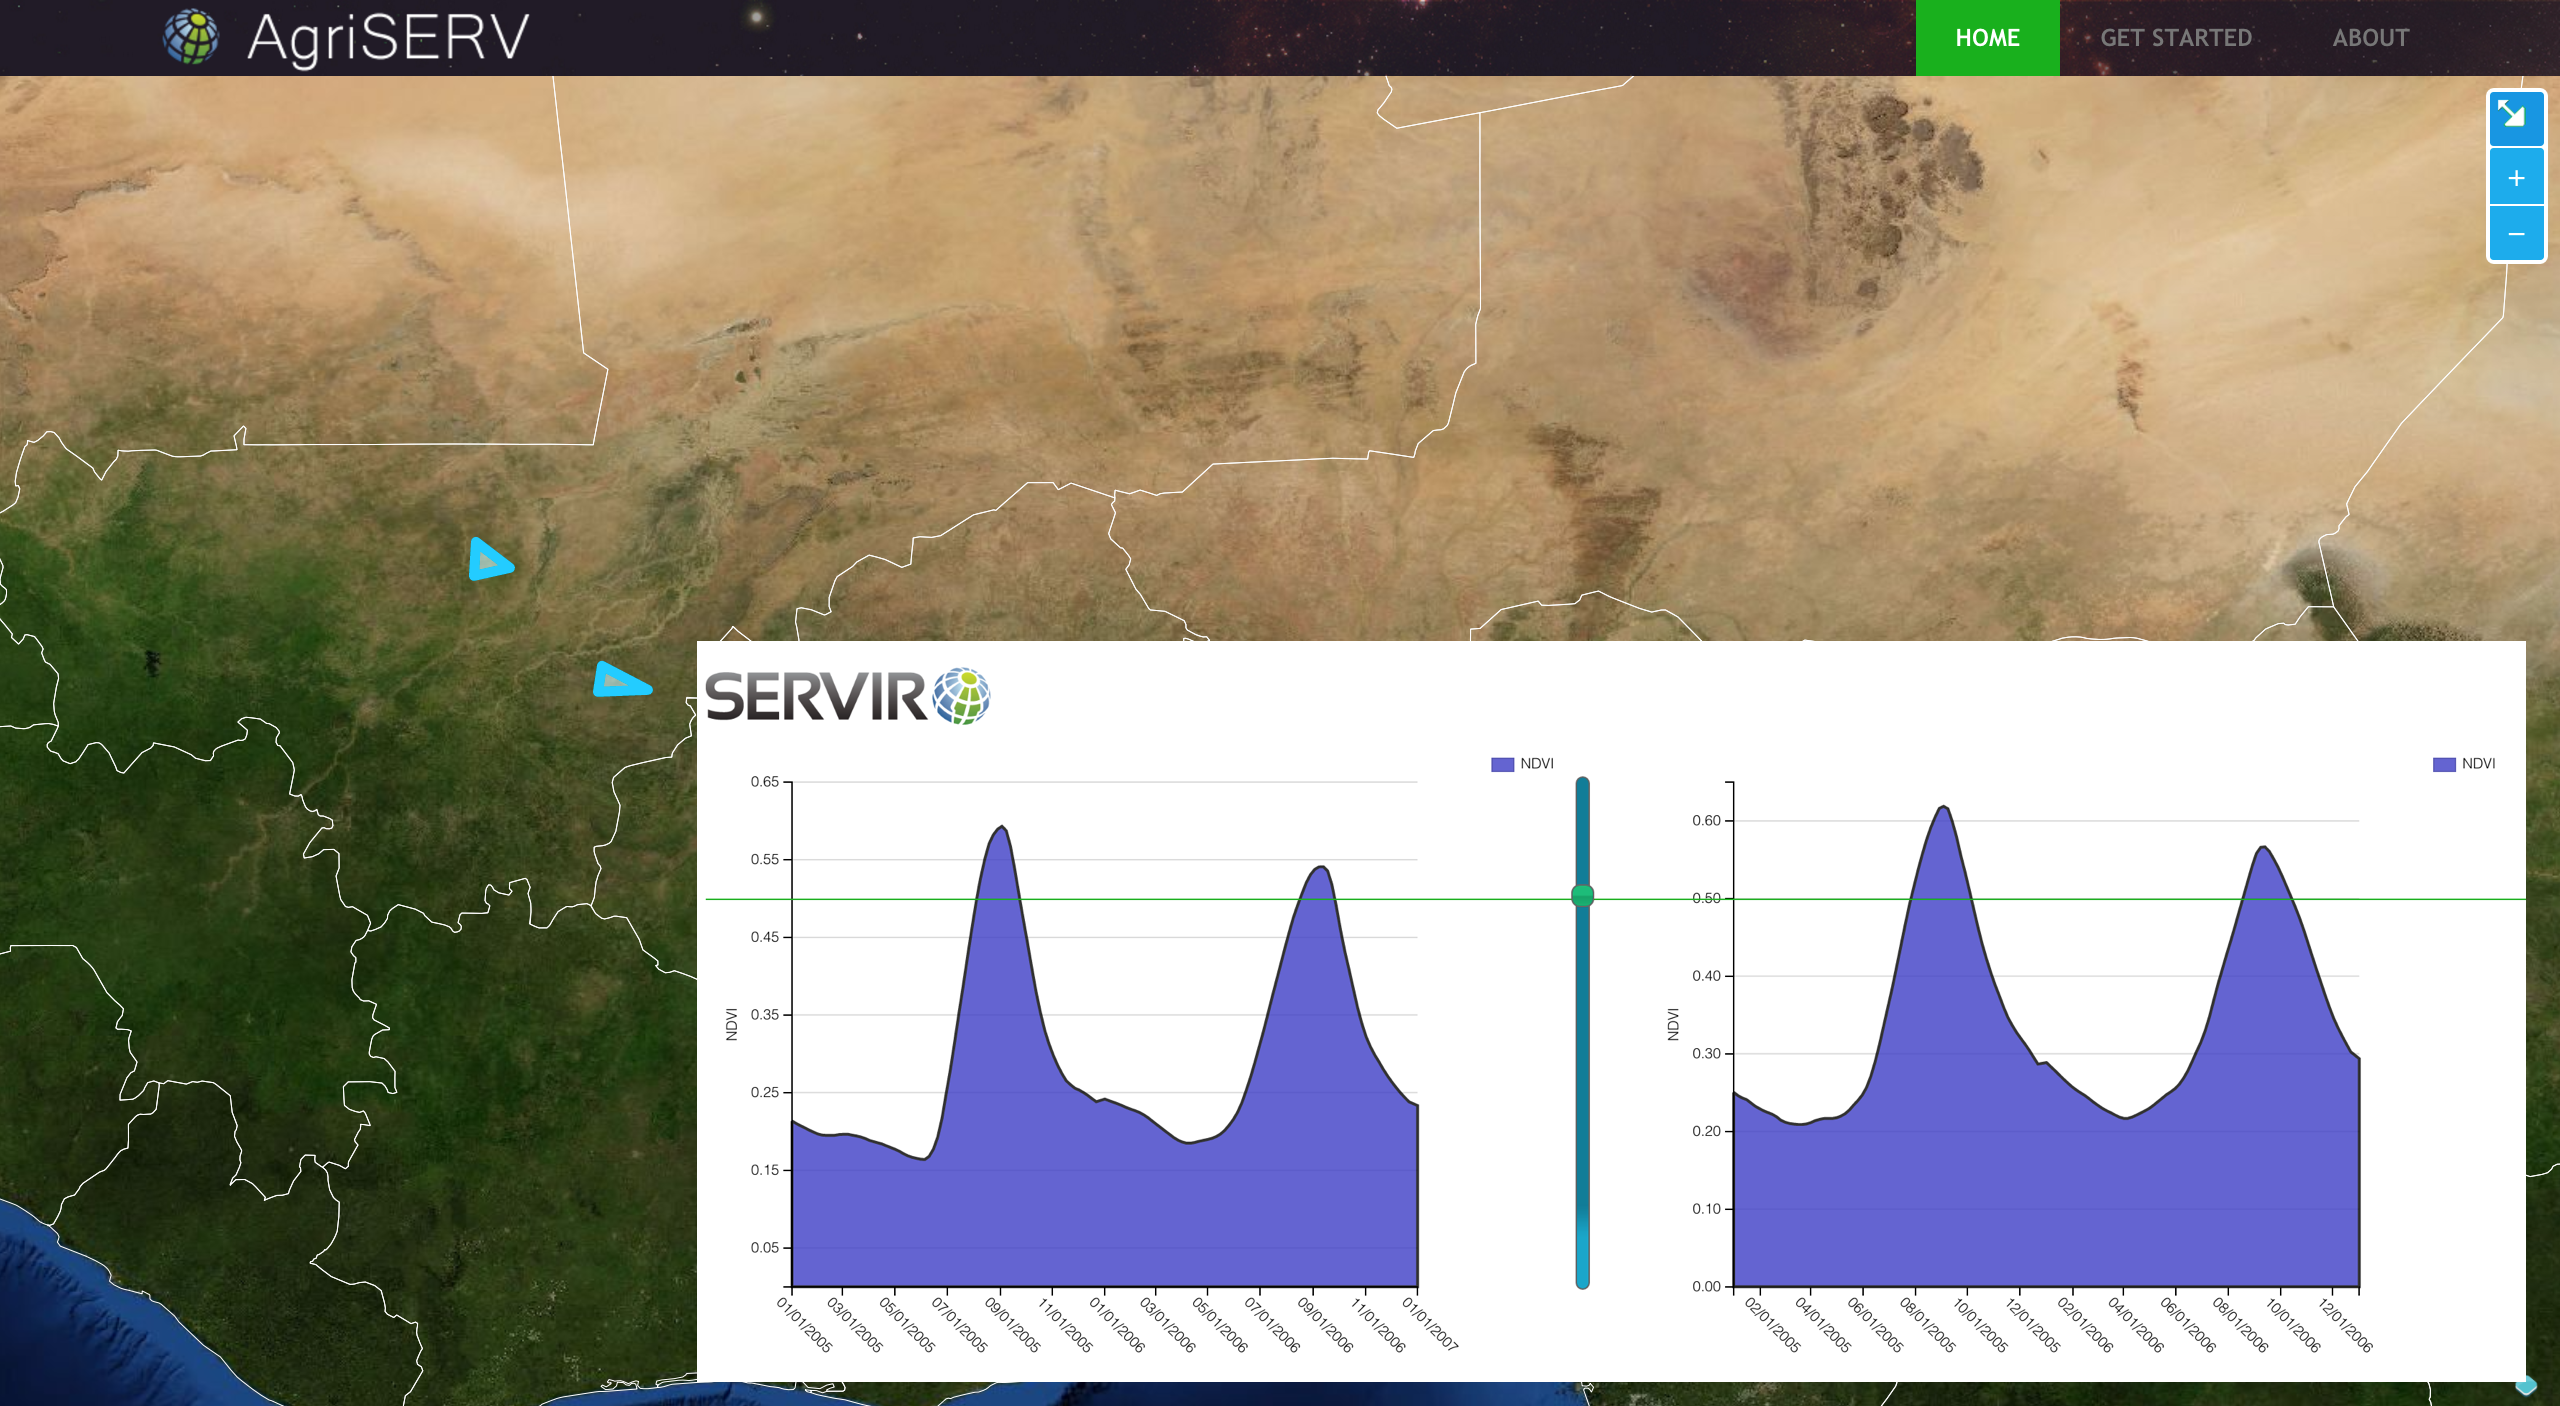
With AgriSERV, users draw (delineate) two areas of interest: one control area with no intervention and another area that has experienced intervention. Then they specify a time period ranging back to the year 2000, and perform an on-demand comparative analysis. The user is presented with side-by-side charts and summary data that highlight the differences of the two areas in terms of vegetation health, derived growing season lengths, and rainfall. The analysis is based on an area weighted average of the gridded NDVI and rainfall data. The users can download the summary data table as well as the full dataset for the period specified.
“AgriSERV is a great example of how SERVIR cloud services can be leveraged to assist in on-demand analysis for specific interests,” notes Lee Ellenburg, a SERVIR Regional Science Coordination Lead. “This application takes process-heavy analysis and makes it available to a much wider audience.”
AgriSERV first prompts a user to draw two areas of interest identified in the image by the
blue polygons. Comparison charts and summary data are then generated for on demand
analysis and visualization. The user can interactively adjust the NDVI threshold to
estimate the ‘growing season’ and the summary data is updated automatically. The user
can also opt to download the full delineated data separately for post analysis.
Notes:
The tool is available here: https://agriserv.servirglobal.net/agriservindex.html
More information on CHIRPS and eMODIS NDVI:
CHIRPS: Scientists at Famine and Early Warning System (FEWS NET) who are members of the SERVIR Applied Sciences Team used 30 years’ (1982- present) worth of multiple satellite data sources and ground observations to produce an unprecedented, global, spatially and temporally consistent and continuous 30-year record of satellite-derived rainfall data. This CHIRPS global dataset makes it possible to accurately assess and monitor large-scale rainfall patterns and analyze how they may be affected by climate change. The data are updated to the latest available rainfall estimates.
eMODIS NDVI: NDVI, a measure of vegetation condition, provides a proxy for agricultural productivity by showing photosynthetic activity. The US Geological Survey Earth Resources Observation and Science (USGS EROS) Center distributes a collection of satellite-derived vegetation products generated from the Moderate Resolution Imaging Spectroradiometer (MODIS). These products, known as "eMODIS," are used by operational land monitoring applications requiring near-real time NDVI data for comparison against historical records. Real-time and historical NDVI products are composited in 10-day intervals every 5 days on a geographic mapping grid. eMODIS 10-day maximum-value composite NDVI images at 250m spatial resolution are used to monitor vegetation condition. NDVI is a measure of the density of chlorophyll contained in vegetative cover and is defined as (NIR - RED) / (NIR + RED), where NIR is the near-infrared reflectance and RED is the visible-red reflectance.